CISCO Catalyst monitoring in the Meraki cloud? Monitoring of the Catalyst 9200, 9300 and 9500 in the Meraki dashboard. Access your access and distribution infrastructure from anywhere, with visibility into what is happening on your network, applications and users.
When we think of Catalyst, we can assure that it is a robust platform, with the technological requirements to provide secure access, scalable connectivity and investment protection. When we talk about Catalyst, we talk about reliability, availability and granularity.
When we think of Meraki, the first thing that comes to mind is the simplicity of network operation, the scalability of its cloud platform and the agility in the implementation of services and monitoring. When we talk about Meraki, we talk about lean-it, speed and secure access to my network from anywhere.
Can you imagine both descriptions coming together and being part of the same platform?
Well, the wish of many IT people has come true, the first of many Catalyst integrations with Meraki, integrating the largest cloud management platform to the largest networking platform. Key announcements include:
- Monitoring of the Catalyst 9200, 9300 and 9500 in the Meraki dashboard. Access your access and distribution infrastructure from anywhere, with visibility into what is happening on your network, applications and users.
Do I now have to buy new Catalyst switching in order to access Meraki?
The answer is NO! If you already have one of this family with a DNA license (which comes by default with the purchase of the solution), you are entitled to use the Meraki dashboard. Did you run out of DNA license and did not renew? Don’t worry! We give you one year free to try the dashboard.
What can you see on the Meraki dashboard of the catalyst?
Currently monitoring:
– List of your Catalyst 9200 9300 9500. Inventory.
– Their current status.
– Status of their active/trunk ports…
– Clients connected to the ports.
– Ability to turn a port on/off.
– Ping.
– MAC forwarding.
And more management functions in future phases.
Compatible Catalyst hardware:
Cloud monitoring via the Meraki dashboard is compatible with the following Catalyst hardware:
• Catalyst 9200/L Series
• Catalyst 9300/L/X Series
• Catalyst 9500 Series
• IOS-XE versions running from 17.3.x to 17.8
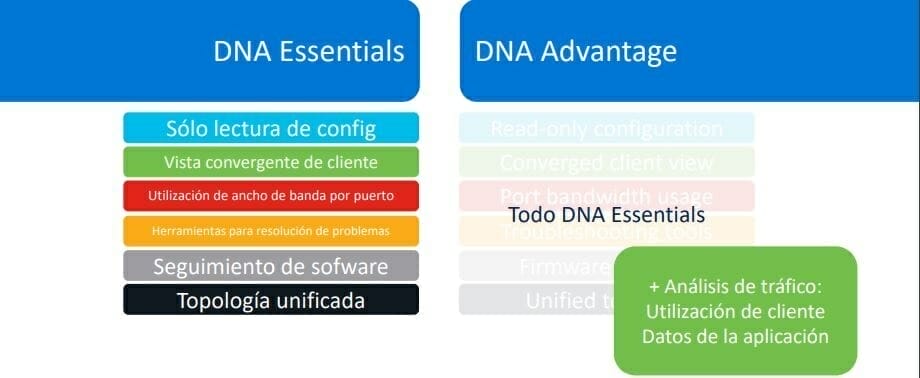
DNA Advantage, DNA Essentials Subscription (DNA Essentials will not provide application or usage data)
Remaining C9000 Switches on Roadmap
- Refer to the network topology. In the Network-wide tab, take a look at Monitoring > Topology to see the map of all connected devices.
- Monitor the status of the switches. The switch list not only displays all devices, but also shows critical status details in a single view.
- Inspect the port details. Click on any Catalyst switch to view real-time port, stack and configuration status information.
- Track customers and traffic. On the traffic side, get detailed telemetry on each client connected to your network.
- Remote troubleshooting Are you experiencing connection problems? Reset and ping test the port from anywhere in the world.
- Worry-free applications. Query any application running on the network and locate the owner in the blink of an eye.

